

The Impact of AI on work project had two phases. In the first phase, any Californian could share their views through an open online survey. In the second phase, we invited interested survey-takers to live discussions.
How we did this work
The methods we used to host and analyze conversations about AI
Balancing each group, fairly
We needed to decide who to invite. And we needed to choose fairly, while creating balanced groups.
So we used an approach called sortition, which is like how courts choose juries. It is built on two equally important ideas:
- Representation: We set demographic goals based on California population estimates. This would make the final list of invitees reflect the diversity of the state. Criteria included things like age, geography, and field of work.
- Randomness: Within those goals, everyone who fit had a fair chance of being selected.
These principles ensured we wouldn’t hear only from those who responded first. It let us build a fairly-chosen list that roughly reflected Californians as a whole.
Demographics
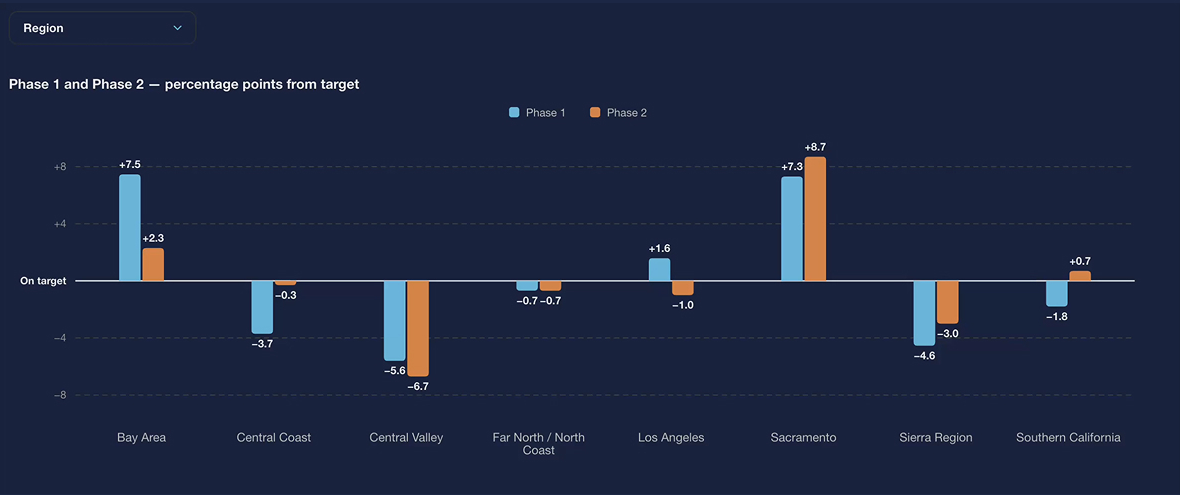
See how close we came to our demographic targets. Click the drop-down menu for measurements by:
- Region
- Race / ethnicity
- Gender
- Field of work
- Age
Demographics of survey vs. discussions
Sortition brought us closer to balanced demographics in the discussions.
Source for targets
- Region: Every region gets a guaranteed voice (at least 6). We filled the rest of seats proportional to California's 2026 population using American Community Survey (ACS) estimates.
Source for targets
- Race / ethnicity: Mirrors 2026 Census / CA DOF projections.
Source for targets
- Gender: Mirrors 2026 Census / CA DOF projections.
Source for targets
- Field of work: Based on California Employment Development Department’s Industry Employment & Labor Force (CES) statistics for April 2026 and area selection tables. The memo to the Governor’s Office specifically calls out logistics, healthcare, legal and financial services, creative industries, the public sector, and academia as priority sectors. We reflected that in these categories.
Source for targets
- Age: Mirrors 2026 Census / CA DOF projections.
More about sortition
- Our sortition code
- Sortition Foundation, Why Sortition Algorithms?
Ranking policy ideas
In the discussions, participants proposed policy ideas, then voted on them as a group.
We compiled all ideas that got at least one vote in a discussion. Then we grouped similar ideas together and wrote a summary for each group. These became the 26 policy ideas. Policy ideas covered between 1 and 12 individual policy proposals.
To rank the policy ideas, we evaluated each one based on 2 factors:
- Frequency: How often a policy idea came up in the 14 discussions. Counts ranged from 1 to 8.
- Support: If a policy idea reached the top of votes in a discussion. To be in the top, it had to gain votes that put it in the top third. Counts ranged from 0 to 5.
We sorted the list of policy ideas by frequency. Then we split it into roughly two halves and labeled the top half “high frequency.” An idea was “high frequency” if it came up in 5 or more discussions.
Then we sorted the policy ideas by support. We labeled an idea a “top idea” if its related ideas were in the top 3 of themes across all sessions.
The order of ideas has some meaning, but is not absolute. For each factor, we calculated the idea's rank compared to all the other ideas. We then added these ranks together to give each idea a score. We put the ideas with the highest score at the top. When policy ideas tied, we used alphabetical order.
Download all the policy ideas
You can download and read all the policies people proposed in the discussions. They are in a CSV file.
How we used AI
Our staff used AI to help us review and analyze these discussions.
Examples of AI use include:
- converting discussion audio into transcripts,
- creating high-level summaries of discussion and survey responses, and
- tagging parts of conversations with the ideas they covered.
AI did not pick who we invited to discussions. We chose invitees by lottery. We made sure the group of invitees reflected California demographics. We also used AI to assess respondents’ outlook on AI. This gave us a mix of viewpoints.
We protected what participants shared with us. All AI work ran inside the state's secure data environment. We never shared transcripts or survey responses with AI vendors. No content was used to train AI models.
AI never replaced human judgment, and it never wrote or edited a participant's words. Every quote in this report is what a participant said. We validated them against the transcript and had them reviewed by staff.
Our staff identified the policy ideas and themes we highlight in this report on their own. They reviewed the transcripts and survey responses without help from AI. When AI helped with analysis, we made it give exact citations. Staff checked those statements before relying on them.
In testing, we compared AI summaries against notes taken by human notetakers. We found they covered the same ground without inventing content.